Trade headlines are constantly evolving —here’s what happened, why markets bounced back, and the milestones to watch next.
Washington resets the tariff playbook
In mid-May, the White House signaled a more aggressive approach by announcing it would unilaterally set tariff rates for dozens of trading partners, moving away from case-by-case negotiations. Simultaneously, the administration paused some of its own actions: a 34% “reciprocal” tariff introduced in April was suspended for 90 days beginning at midnight on May 14. During this period, a baseline 10% tariff remains in effect as officials pursue a broader agreement with Beijing.
Two sectors continue to draw attention. A February proclamation revived the prospect of increased Section 232 tariffs on aluminum, citing that current duties have not sufficiently expanded domestic production. Meanwhile, a recent Ernst & Young report estimates that a proposed 25% tariff on imported pharmaceuticals could raise U.S. drug costs by approximately $51 billion annually if implemented in its current form.
From sell-off to snap-back on Wall Street
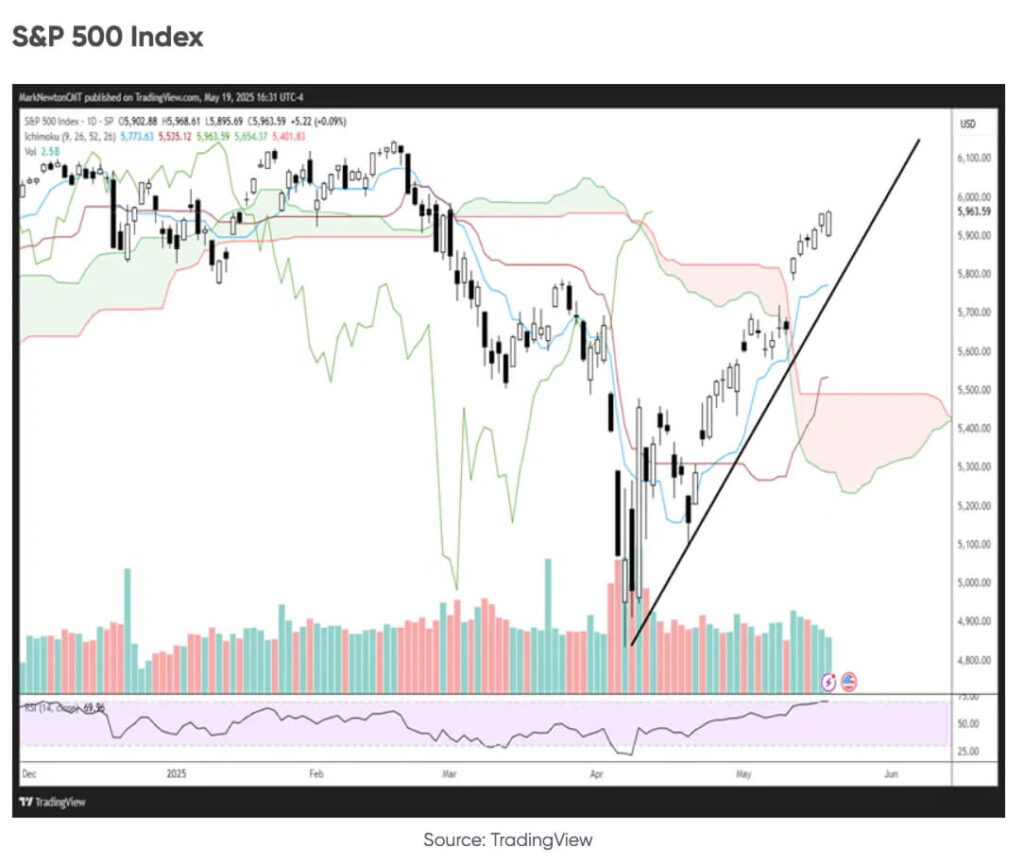
Stocks initially tumbled when the sweeping tariff plan was unveiled in early April, but quickly rebounded following news of a 90-day truce and cooler-than-expected inflation data. By Friday May 9th, the S&P 500 was flat for the year and had erased its year-to-date losses.* This marked one of the fastest “V” shaped recoveries in the history of the market. Broader indices showed an even more dramatic recovery: the Russell 1000** has surged roughly 18% from its mid-April low, effectively retracing the decline it saw during the peak of tariff-related concerns.
Source : Fundstrat
Analysts attribute the rebound to three forces:
- Partial tariff relief. Markets tend to breathe easier when headline duties are scaled back or delayed.
- Benign inflation. April’s 2.3 % year-over-year CPI increase—the slowest since 2021—eased fears that tariffs would ignite an immediate price surge.
- Resilient earnings. First-quarter results, especially from large technology firms, helped offset trade-related uncertainty.
Volatility, however, remains elevated as investors weigh whether the temporary reprieve on tariffs will stick through the summer negotiating window.
Dates circled on our calendar
- June 12 – Mid-truce progress report: U.S. and Chinese officials are due to release an update on talks before the 90-day suspension clock reaches its halfway mark.
- Late July – Commerce review of aluminium duties: Findings could clarify whether higher metal tariffs move forward or are shelved.
- August 12 – End of the 90-day pause: Absent a broader deal, reciprocal tariffs could snap back to 34 % or be revised again.
Each checkpoint has the potential to sway supply-chain planning and market sentiment, well beyond the trade and metals industries.
The bigger picture
Tariff policy is being adjusted in real time, and even short-lived changes can ripple through corporate forecasts, consumer prices, and portfolio performance. The market’s swift recovery shows how quickly sentiment can shift when political pressure eases, but the path forward still depends on litigation, negotiation, and the data prints that shape Federal Reserve thinking.
Stonewater Financial’s research team will continue to follow the policy docket and the market’s response, translating the noise into clear updates as events unfold.
For informational purposes only. This material is not a solicitation to buy or sell any security and should not be construed as investment, tax, or legal advice. All data and views are as of May 16 2025 and may change without notice.
* The S&P 500 is a stock market index tracking the stock performance of 500 of the largest companies listed on stock exchanges in the United States. Indexes are unmanaged and cannot be invested in directly. (102-LPL)
** The Russell 1000 Index consists of the 1,000 largest companies by market capitalization in the Russell 3000 Index, which represents approximately 90% of the total market capitalization of the Russell 3000 Index. It is a large-cap, market-oriented index and is highly correlated with the S&P 500 Index. Indexes are unmanaged and cannot be invested in directly.